The platform that never sleeps
This has been an eventful first quarter for SiteZeus, and we’ve added a handful of new features, data bundles, and nuances to the Synergy platform. Below you’ll find a handful of these premium additions:
UberMedia Pulse technology
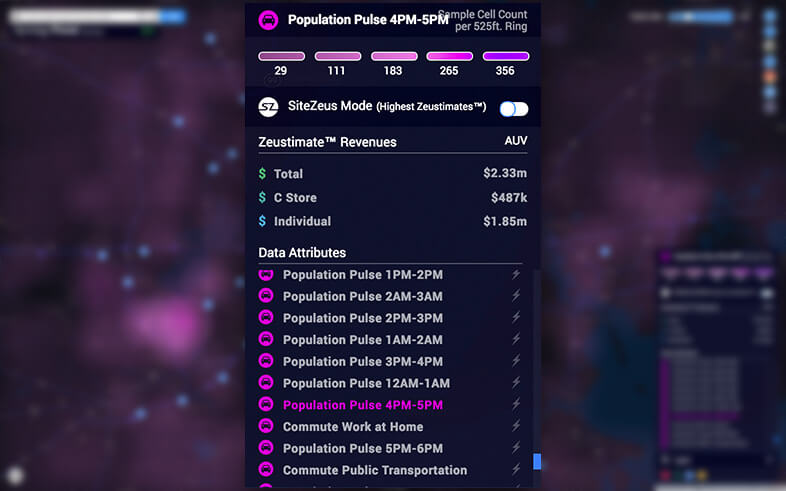
The Olympus Data Exchange took a big leap forward this quarter, as the SiteZeus engine now interprets mobile density data and trends aggregated at census block group or tract level by day part.
Subscribers now have premium access to UberMedia’s granular, cutting-edge population movement analytics. The UberMedia network tracks population density shifts with millions of cellphone data and GPS points. Its inclusion in the Olympus Data Exchange marks an industry first, giving growing brands, brokers, landlords, and developers alike the opportunity to harness the most advanced suggestions artificial intelligence has to offer.
Check out the UberMedia webinar here.
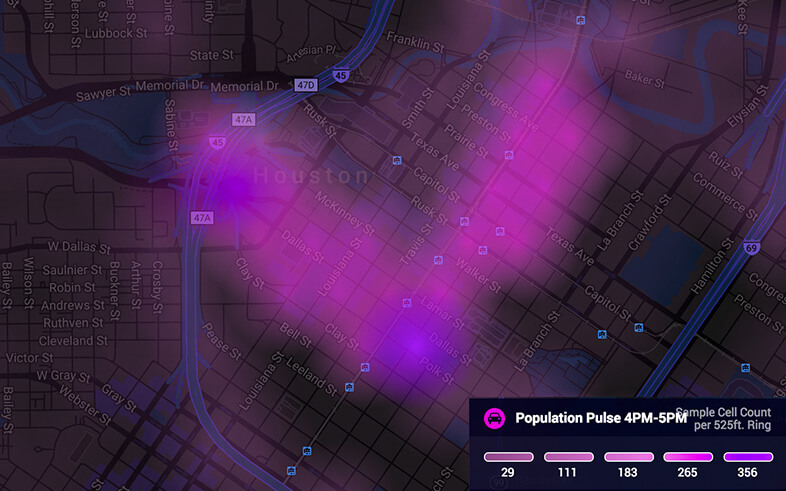
Population Pulse
INRIX day of week and day-parted traffic vehicle count data
As the global leader in transportation data, INRIX provides the most cutting edge, comprehensive & granular data available. With access to over 300 million mobile devices & cars you will never need to spend time on department of transportation websites or counting cars again.
Last October we celebrated our new partnership with INRIX by providing daily average traffic volumes, by direction, for free, to all Synergy subscribers – and we continue to do so. This quarter we trumped that, by launching day of week and day-parted traffic, vehicle counts. This new level of granularity has proven itself valuable time and time again.
If you haven’t already, you should check out our two INRIX webinars: INRIX Volume Averages and INRIX Day of Week / Day-Part Traffic.
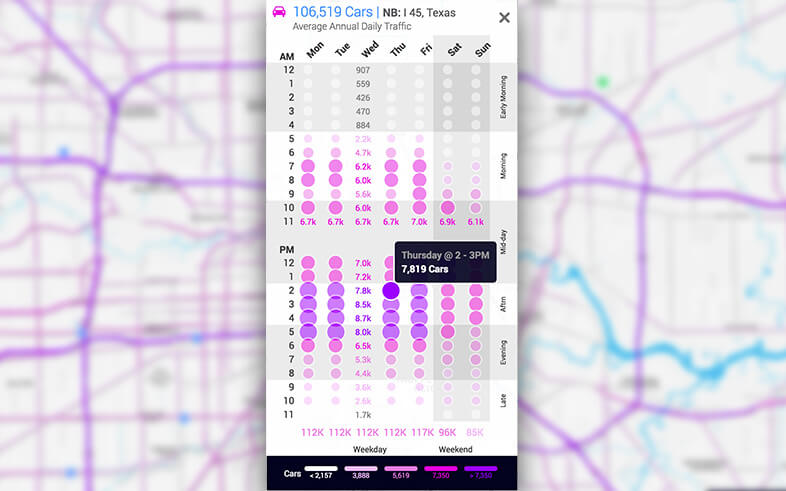
INRIX day of week / part of day
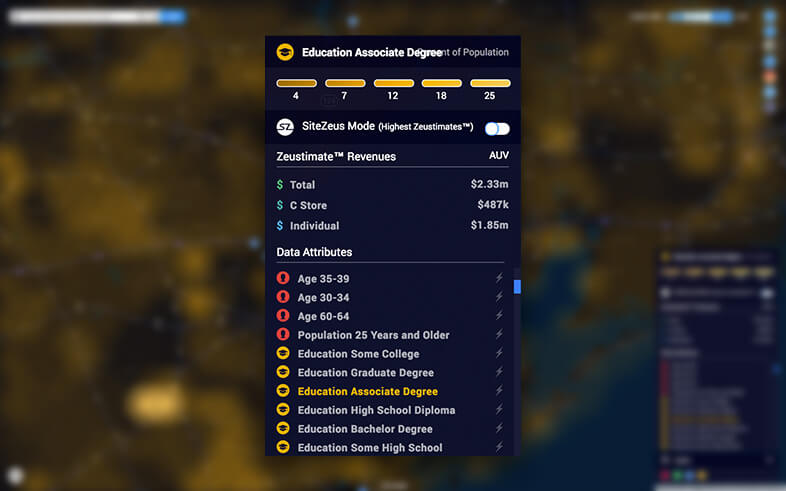
The new Zeustimate container, with quick demographics
For starters, a Zeustimate is an unbiased sales projection that is broken down by revenue or performance type, indicating how a location can be expected to perform. This predictive power generates in seconds and utilizes artificial intelligence and machine learning to calculate and re-calculate Zeustimates, on the fly.
We have updated the Zeustimate container to bring users more information at a glance. There are now 5 projection buckets to categorize your Zeustimates: Excellent, Above Average, Average, Below Average, Poor.
Inside of that same container, you can see quick demographics: population density, gender, ethnicity, age, and median income.
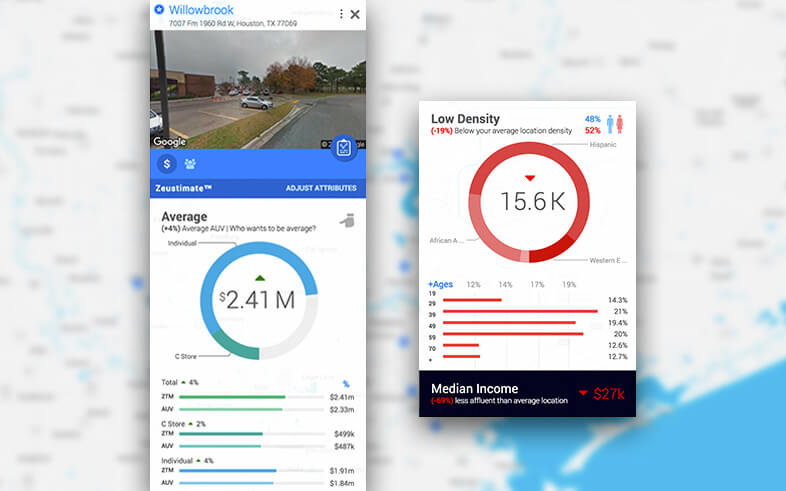
Zeustimate container
Updated heat maps
Arguably our strongest data visualization tool, the heat map now has a new look and packs a stronger punch. We’ve updated and boosted the predictive nature of the mapping tool, to give more granular visualization, affecting both the revenue heat map as well as the demographics heat map.
Updated heat maps
Pinning trade areas
You can now pin trade areas around locations to the map to better visualize distance between locations and competition. Our pin bar allows for easy visualization and reporting on these pins has never been easier.
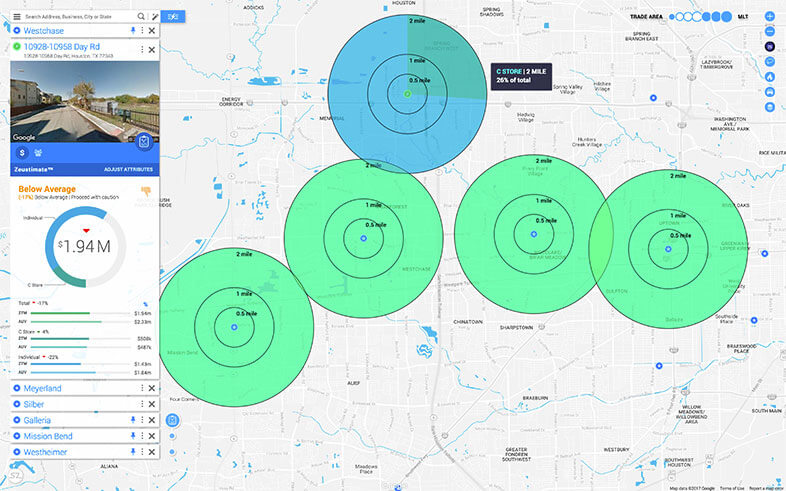
Pinning trade areas
Recommended Posts