What’s Improved in the Atlas Release: A Tour of the Upgrades Across SiteZeus Locate
A tour of what’s been rebuilt in the Atlas release of SiteZeus Locate: saved white space runs, modernized visualizations, smart filtering and split-screen workspaces, heat mapping on any shape, national-scale analytics, custom A–F scorecards, and mobile.
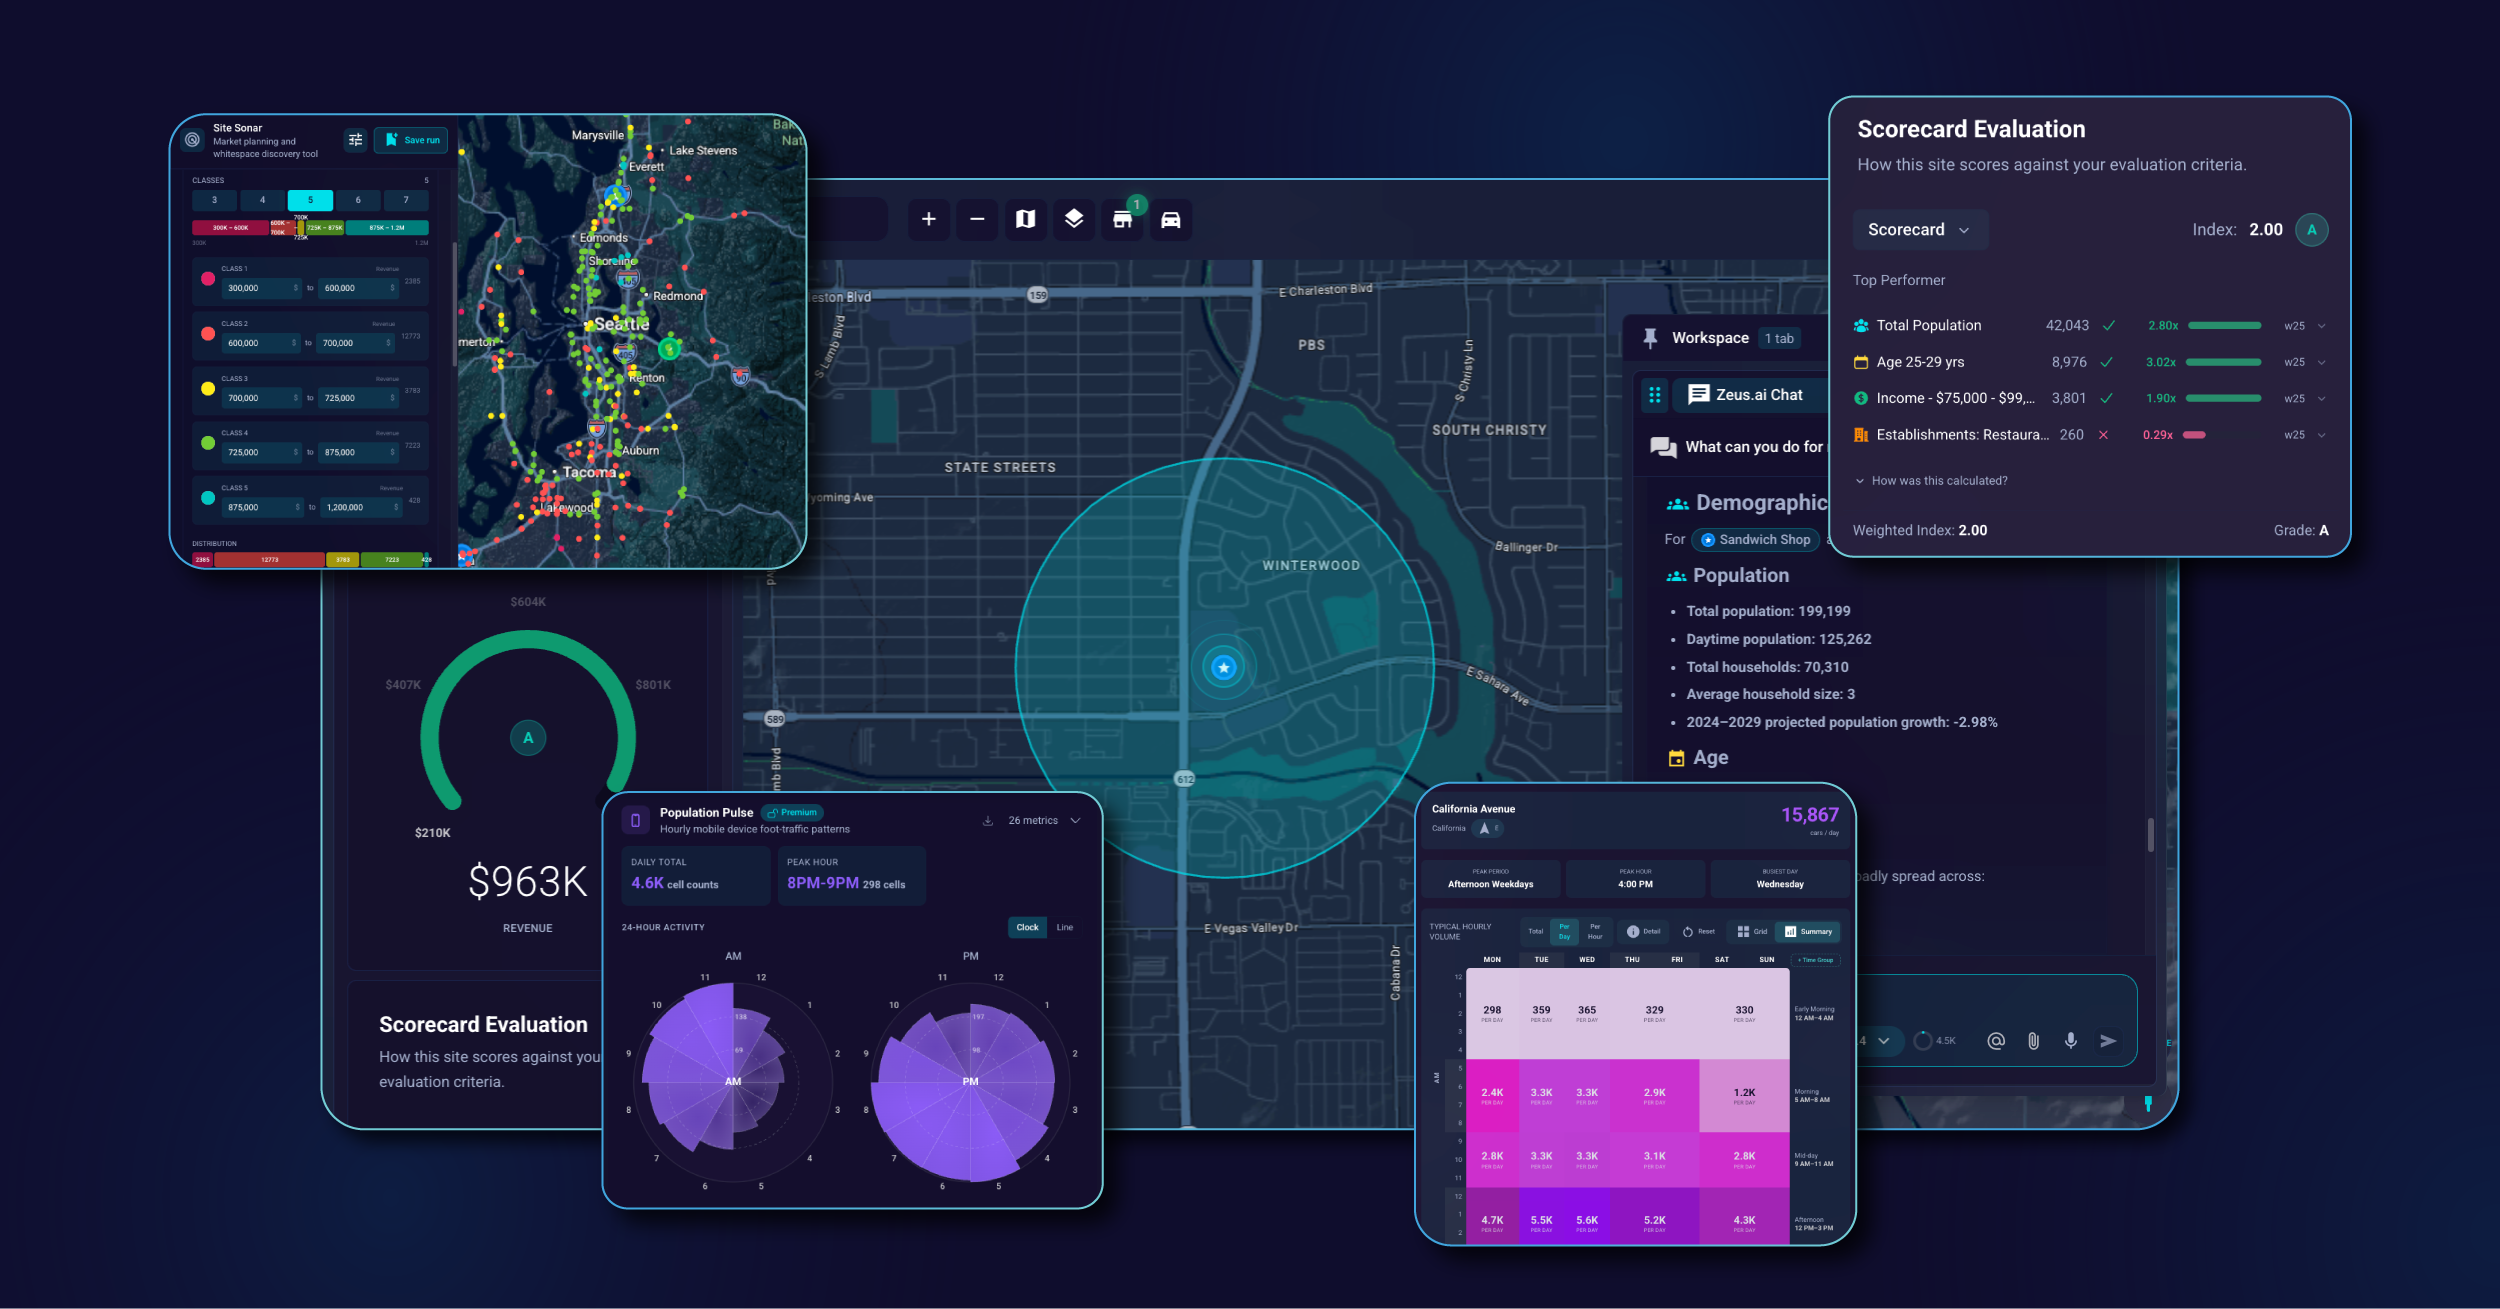
The Atlas release of SiteZeus Locate is a complete reinvention of the platform. Alongside the new use cases, the release brings material upgrades to the tools expansion teams reach for every day — the visualization, analytics, data displays, and workspace mechanics that sit at the core of any site selection, market planning, or expansion strategy workflow.
White space analysis — saved runs and centralized layer control
White space analysis runs are persistent across sessions. Saved runs sit alongside indirect traffic, demographic overlays, and other map layers in a centralized layer-control panel, where each one can be toggled on and off as the trade-area story evolves. Run the analysis once and reference it for as long as the project lives.
Modernized data visualizations across demographics and traffic
Demographics now render as visualizations rather than tables. The tables held all the same data, but rows of numbers were hard to extract real insight from — patterns got buried, comparisons took time, and stakeholders ended up translating everything in their head. The new charts cover age distribution, age-by-gender, ethnicity, income, consumer spending, home values, vehicles per household, commute split and times, and population trends, making it dramatically easier to see what each dataset is actually saying about the area. Sales-comp and consumer behavior data are visualized too, with tooltips that surface the brands lifting or dragging trade-area performance.
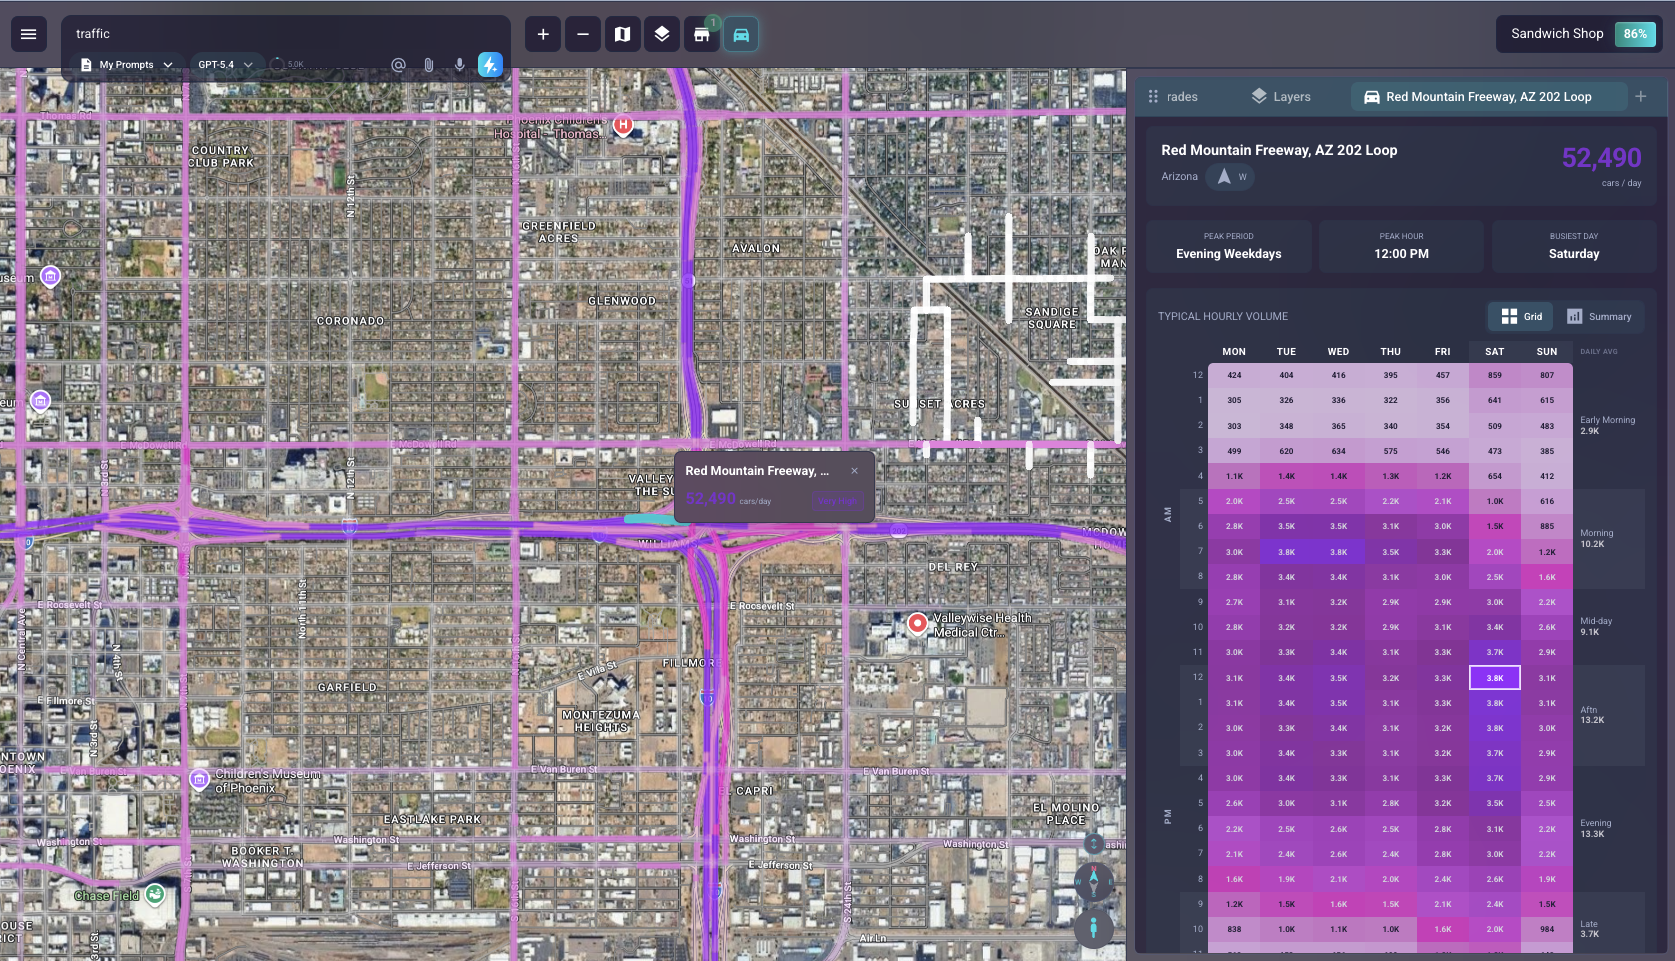
Traffic data gets the same treatment. Hovering a road segment surfaces the segment name before you click, and the traffic grid view includes a written summary of busiest day, peak period, and total volume. A custom time-group slider lets you define your own time windows — early morning for coffee, late evening for bars — so traffic reads match the dayparts that matter for your concept.
Modernized UI — smart site filtering, map overlays, and split-screen workspaces
Filter the sites panel by any attribute or revenue field, with the data distribution shown alongside each variable so you can see the shape of the data while you filter. Quick-filter shortcuts include top, middle, and bottom-third buckets for any selected metric, with the map updating live as you go — useful for cleaning up the map to focus on a specific type of site, whether that’s top performers, a particular format, or sites that share an attribute.
Sites on the map carry layered overlays — color halos (gradient on revenue or any attribute), status tags, labels, and configurable pin styling — that combine freely on the same site. Stack a revenue halo with a format tag for committee, or a status tag with a label for franchise development. Pop-ups are customizable so you only see the attributes that matter for the current question.
A browser-style tab system lets you open multiple sites at once and drag-and-drop them into split-screen views, comparing two or three sites side-by-side with full visuals — sales forecasts, demographics, smart comps, and the live map all rendered simultaneously. Workspaces persist, so closing or refreshing returns you to exactly the state you left.
Heat mapping on any shape and any attribute
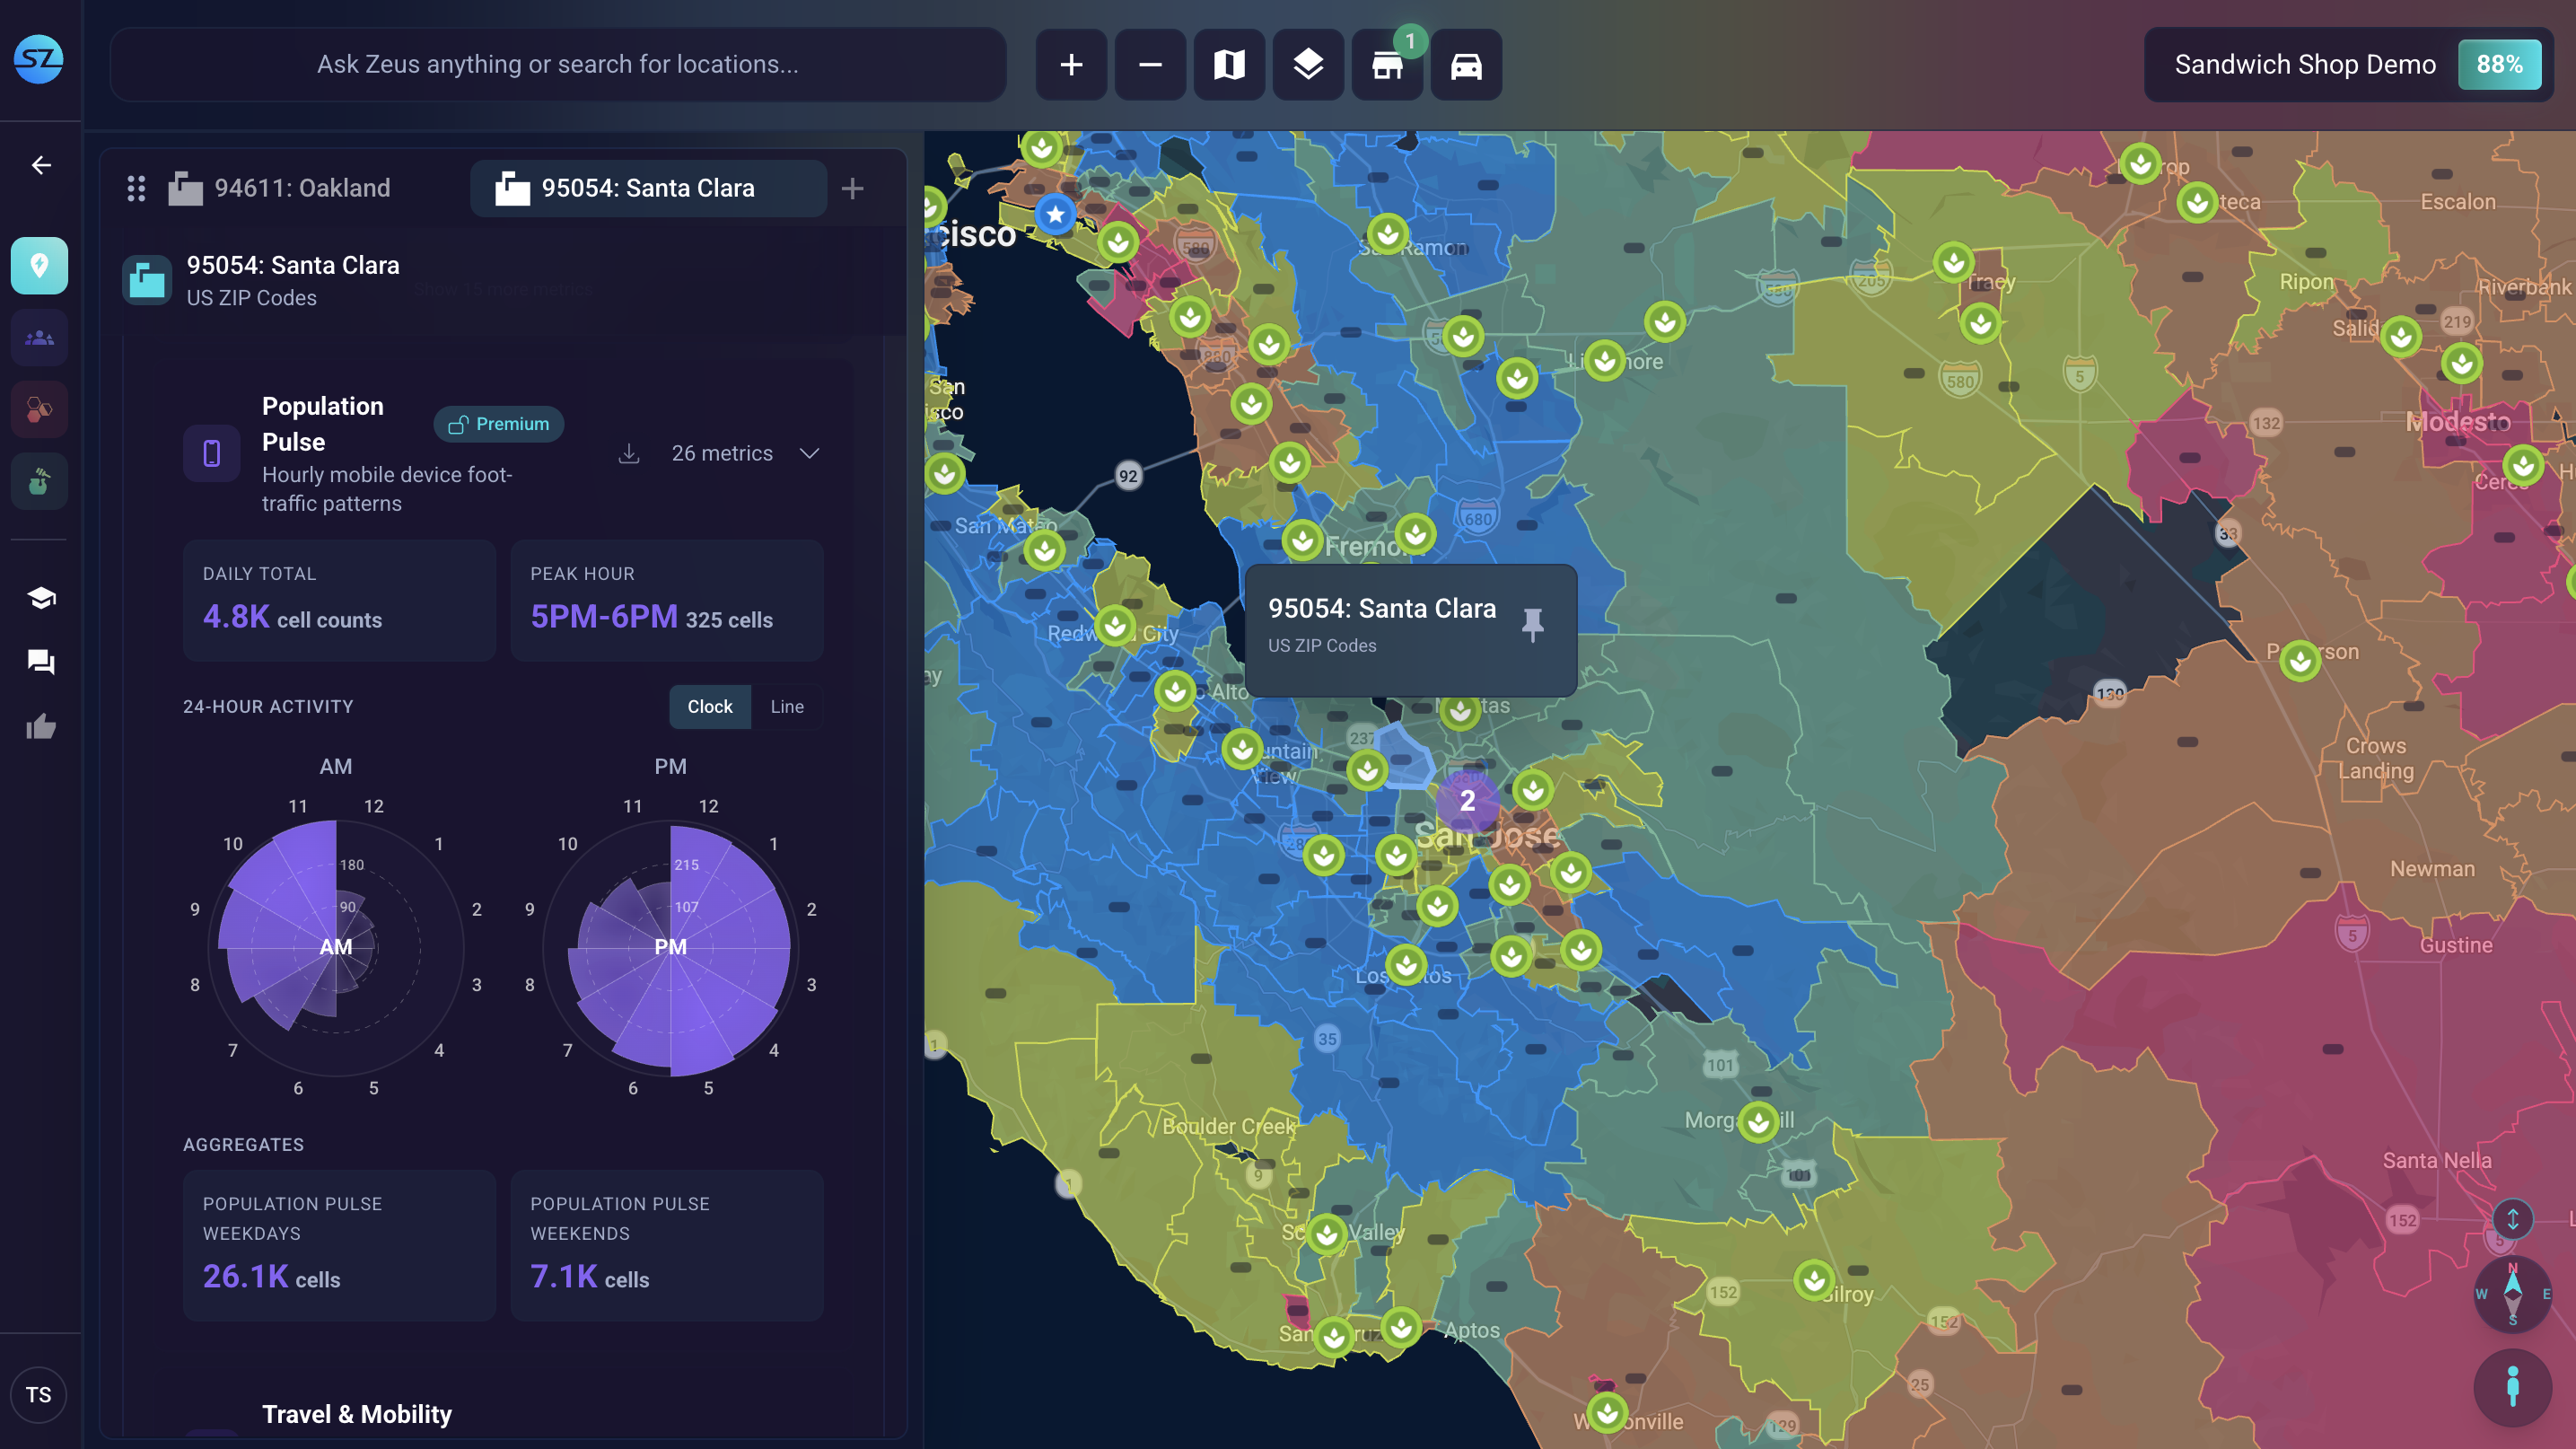
Heat mapping has been rebuilt on the new shapes engine, so any shape geography — zip codes, DMAs, custom territories — can be colored by any underlying attribute. Configurable color ramps, themes, and continuous or stepped scales make trade-area reads, national strategy maps, and custom territory views all work off the same flexible visualization engine.
Shape analytics and national-scale performance
The shapes engine has been rewritten to handle dramatically more data — over 30,000 U.S. zip codes simultaneously, up from a prior cap around 3,000. Click any shape — custom territory, DMA, region, zip — and open it with the same full analytics suite as a site, giving national-scale planning the same depth as a single-site evaluation.
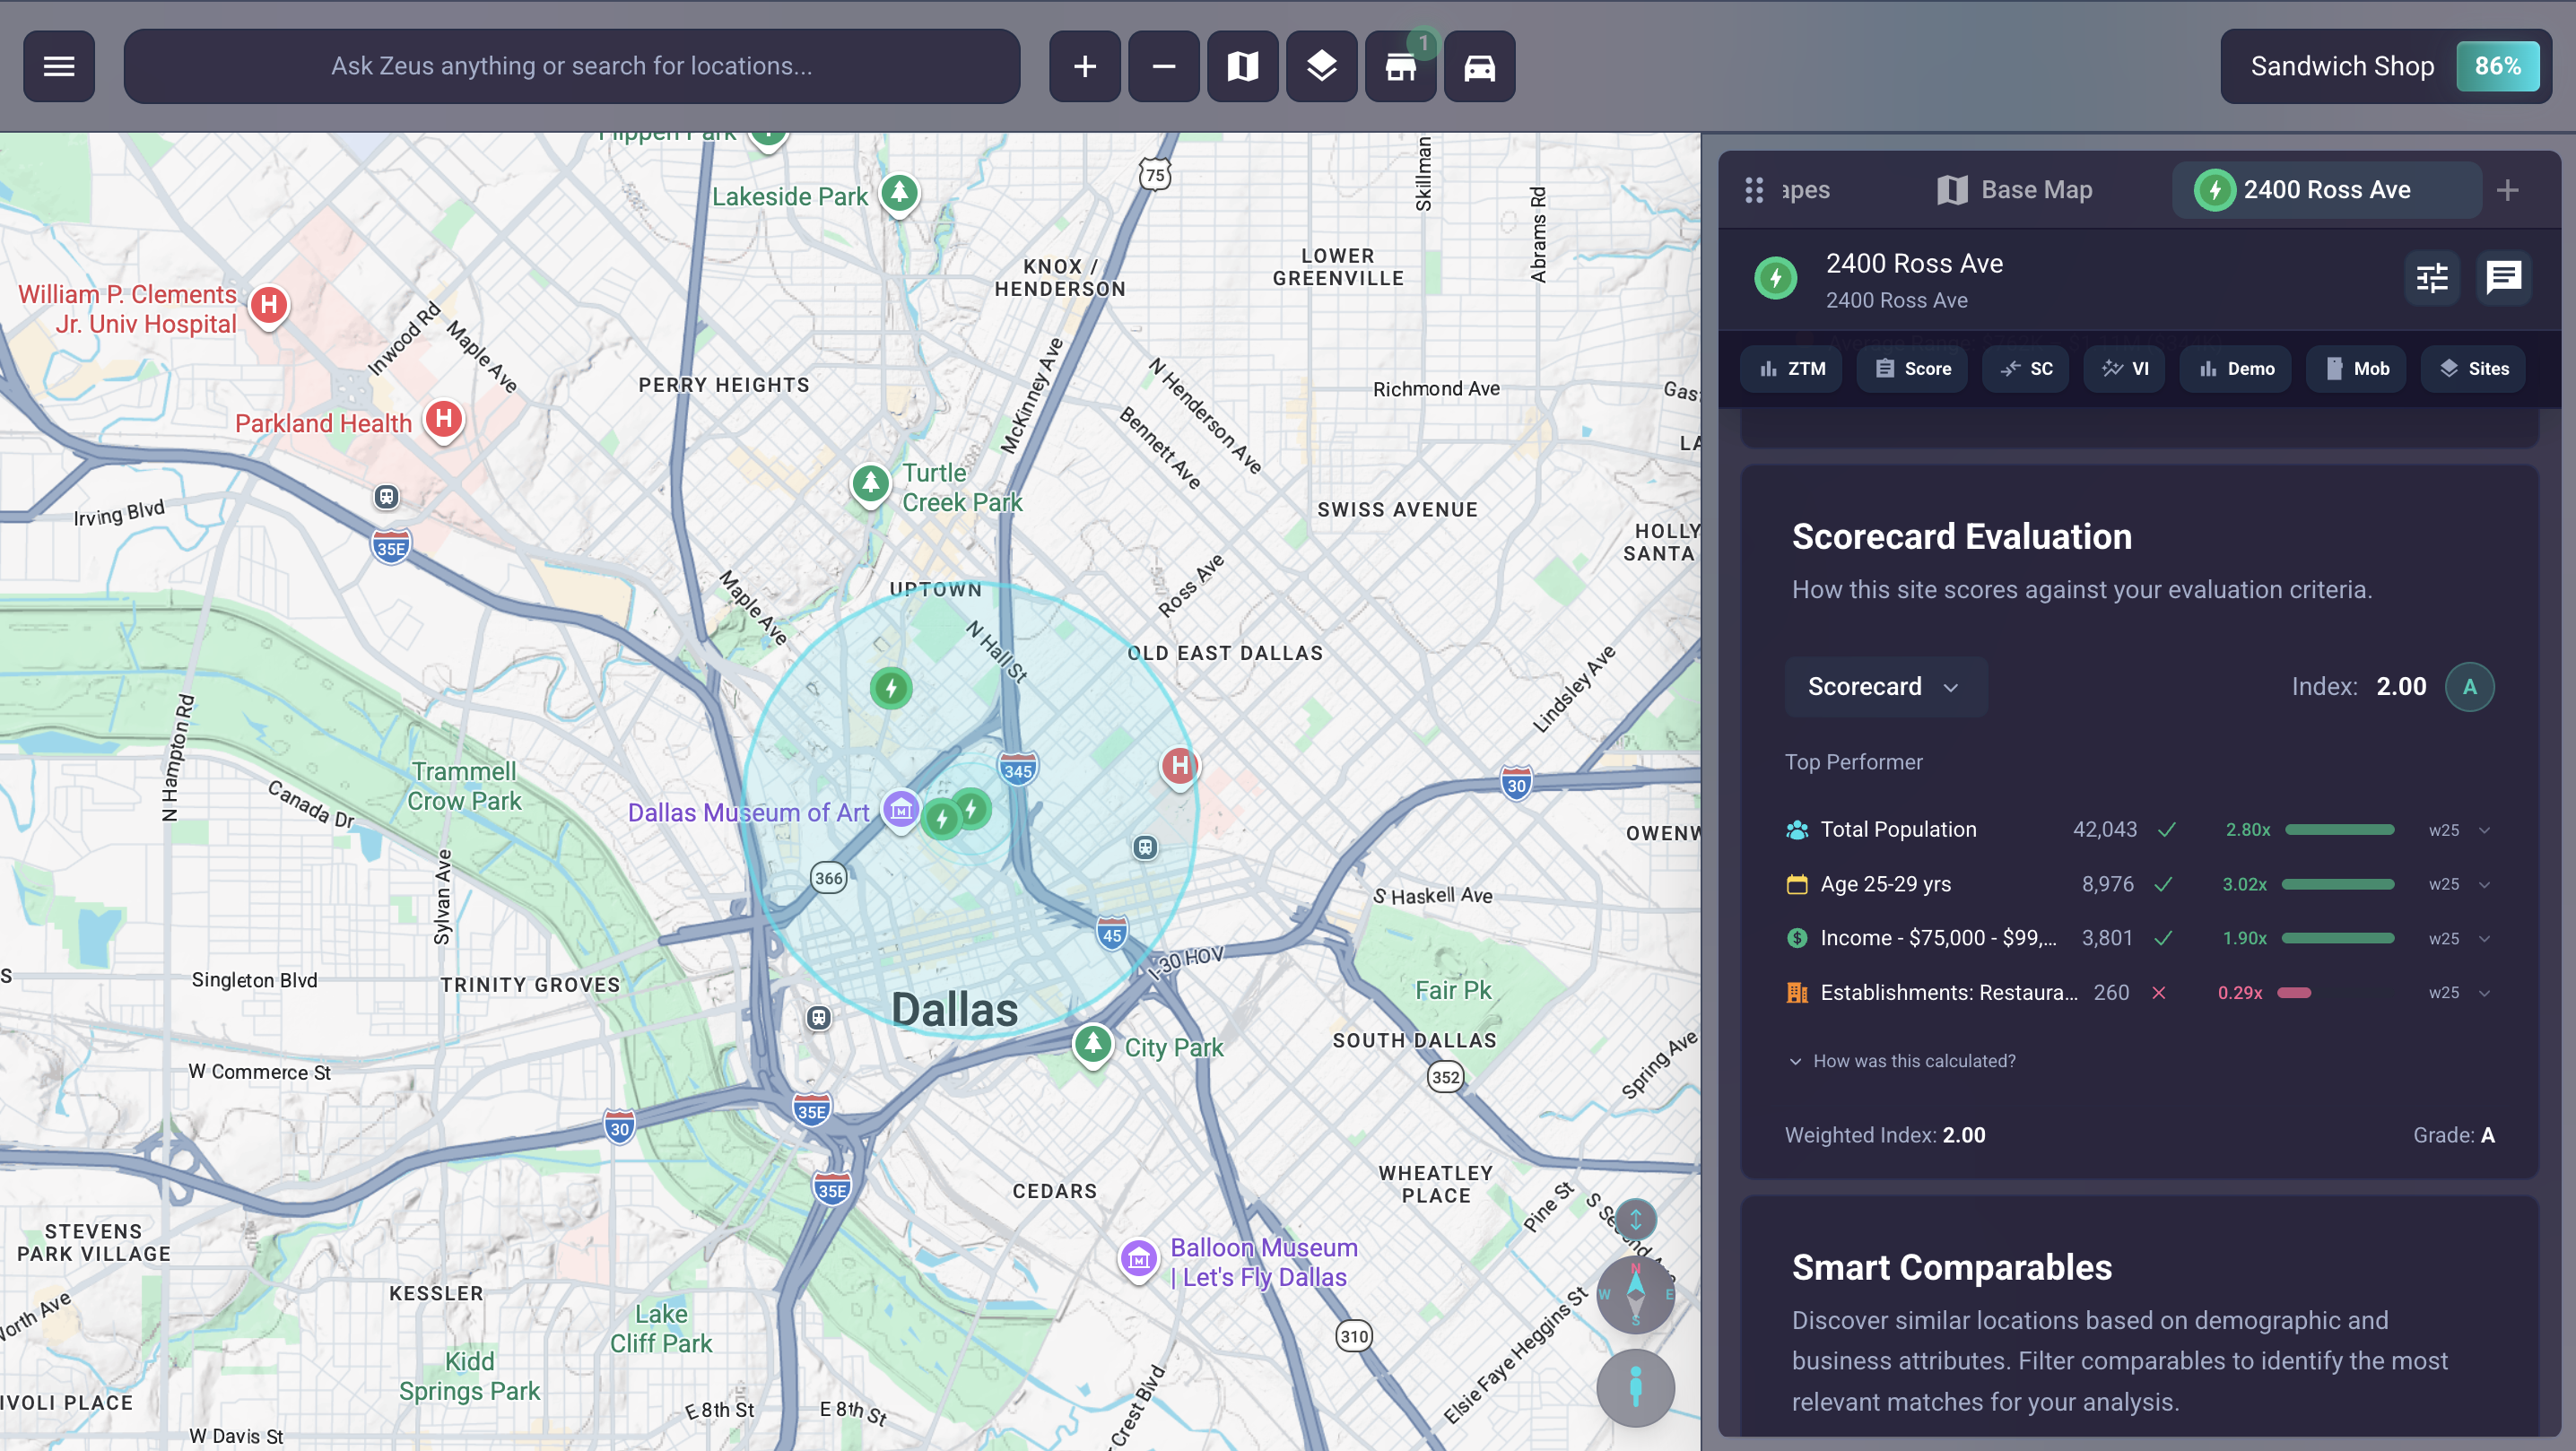
Custom A–F scorecards
A fully configurable, weighted evaluation framework for sites, shapes, or both — define sections (sales forecast, demographics, competition, on-the-ground), assign each a percentage weight, and add variables with thresholds. Outputs are letter grades, so geographies at very different scales — a single corner versus a full DMA — can be compared on the same consistent criteria. Brands without enough sites for a predictive model finally get a rigorous, business-logic-driven alternative to gut feel.
Mobile functionality for on-the-go site analysis
SiteZeus Locate now travels with you. Pull an executive summary from your phone mid-conversation, get a trade-area read during a site visit, or answer a franchisee’s market question on the go — no login flow, no map navigation, no project setup. Mobile access pairs with Zeus.ai Chat so the people who need answers most often — field teams, franchise developers, operators — can get them wherever the work happens.
See the Atlas release of SiteZeus Locate in a live demo
The clearest way to understand what these upgrades change is to watch them run on a live evaluation. Schedule a demo and we’ll walk you through the improvements that matter most to your workflow.
For the full picture of what’s new in this release, read the Atlas launch announcement.
Recommended Posts