Five Things Expansion Teams Need From Site Selection Software in 2026
Forecast accuracy is now table stakes. Here are the five capabilities expansion teams actually need from site selection software in 2026 — plus what holds most teams back from having them.
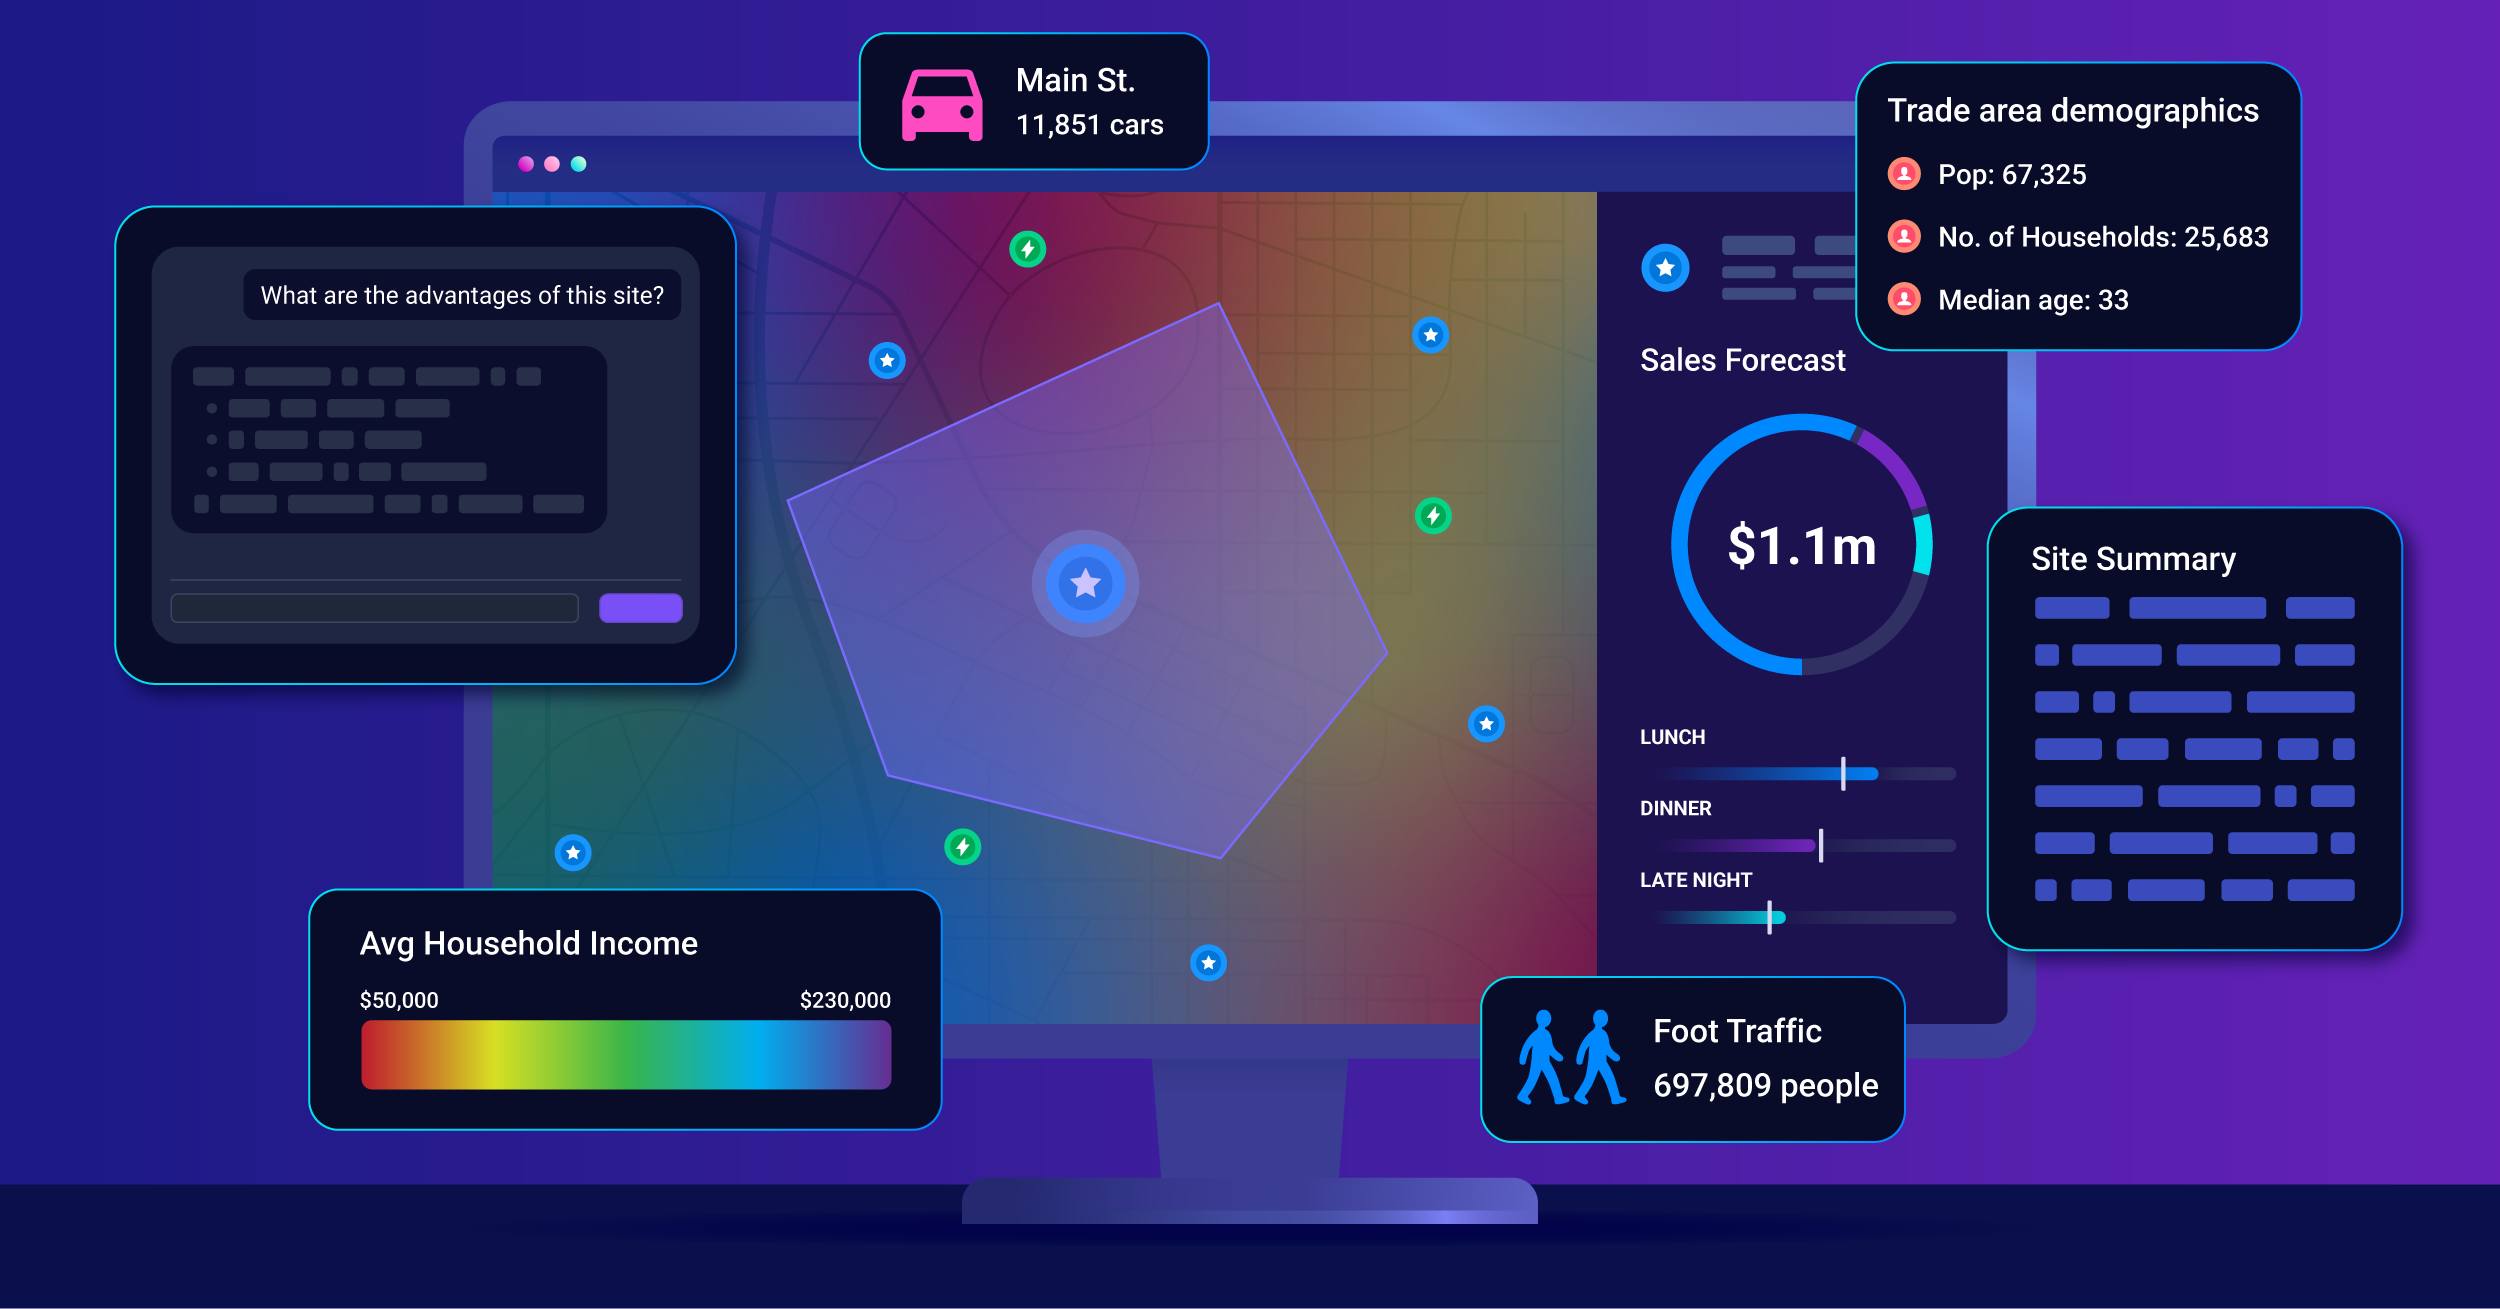
Selecting the right locations has always depended on strong data and sound judgment. What’s changed is the pace expansion teams are expected to operate at — and the level of explanation leadership now expects to come with every recommendation. A forecast number that ships without a defensible breakdown of the why isn’t a forecast teams can act on. It’s a number.
As little as a couple of years ago, most people judged site selection software by its forecast accuracy. Today, that’s table stakes. The expansion teams winning right now require speed for the full analysis (not just the forecast number) and explainability — being able to walk the CFO, the franchise partner, or the board through the reasoning behind every recommendation.
Explainability has quietly become a budget conversation. Deals don’t move forward if the CFO can’t follow the reasoning. A forecast a team can’t defend is a forecast that gets re-run by hand inside the meeting. Expansion teams need to understand and trust the why behind every forecast — the kind of questions a CDO should be able to ask their site selection agent and get a clear answer to in real time.
Five specific capabilities sit underneath those demands — and separate today’s expectations from the previous generation of tools.
The five things expansion teams need from site selection software
- Run hundreds of sites in parallel. Pipeline volumes have grown, and scoring a market’s worth of opportunities at once — instead of one trade area at a time — is now the difference between an expansion team that can keep up and one that can’t.
- See the factors behind every forecast. A forecast number on its own isn’t enough. Teams need to see what produced it — demographics, competitive density, traffic patterns, customer movement, consumer behavior signals, consumer interests — and walk a CFO through those factors without translation.
- Ask questions of your own data, in your own words. Static dashboards and analytics requests used to be acceptable. They’re no longer fast enough. Expansion teams should be able to ask “which of these markets has white space within ten miles of an existing top performer?” and get an answer in the same meeting.
- Territories that update with the portfolio. Annual territory redraws were already a stretch. With pipeline cadences increasing, a territory model that only updates once a year is structurally behind. Boundaries should reflect the portfolio as it actually exists.
- Access from wherever the team is working. Real estate work happens in the field. The platform that runs the analysis can’t be the one tool the team can’t open between meetings.
Why most teams don’t have all five yet
The capabilities above sound straightforward. The reason most teams don’t have them is that the previous generation of tools was built around assumptions that no longer hold.
Black-box forecasting is the most visible gap. A forecast number with no breakdown doesn’t survive the level of scrutiny modern expansion decisions get. A team that can’t answer the CFO’s follow-up question ends up rebuilding the answer in a spreadsheet, which means the platform isn’t actually doing the work.
Static dashboards create another familiar bottleneck. Every new question turns into an analytics request, and the cadence of expansion decisions has outrun the cadence of those requests. Teams need to query their own data, not file for it.
Data layers that don’t connect into a single story round out the common gaps. Most platforms have data partners and a wide set of layers — demographics, traffic, customer signal, competitive context — but stacking layers in one place isn’t the same as connecting them into a readable story. Modern expansion analysis depends on those signals being read together at the moment a decision gets made.
Underneath all of it: most legacy tools were built for analysts, not for the chief development officer evaluating next quarter’s pipeline in a meeting. The user has changed. The interface mostly hasn’t.
What changes when expansion teams have all five
Teams whose tools have caught up make different decisions. They evaluate more sites — because the cost of evaluating one more site is close to zero. The move from “interesting” to “approved” happens faster, because the analysis that supports the approval is already attached to the site. And the CFO meeting starts with the why already on the page, instead of getting assembled from three tools and a memory of last week’s call.
The signal mix is wider than it used to be — demographics, competitive density, traffic patterns, customer movement, consumer behavior signals, consumer interests — and the platform’s job is to read those signals together and surface the factors alongside the answer. Instead of one analyst running one site through one forecast, the expansion team runs a market’s worth of opportunities in parallel, screens them against the strategy, and brings the top of the list forward.
Accuracy, speed, and explainability are the price of admission. Teams reviewing their stack right now should be asking a sharper version of the question they asked two years ago. Not “does this tool produce a forecast we can use?” — but “does this tool produce a forecast we can defend, in the time we have, on the volume of sites we’re actually trying to evaluate?”
See how SiteZeus Locate is built for accuracy, speed, and explainability.

Recommended Posts