Enhance your market-planning strategy with innovative trade-area analyses
Visualize your customers’ paths to purchase and define true trade areas within minutes
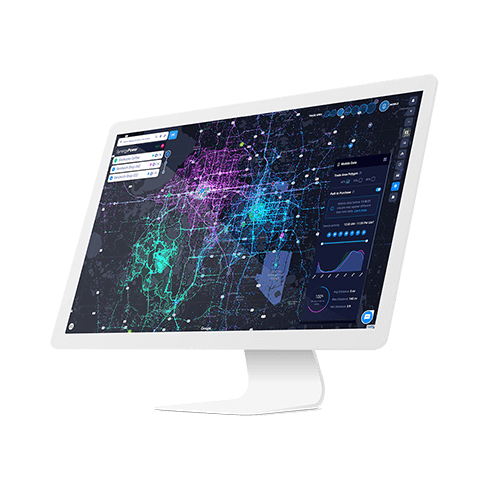
While traditional methods for evaluating existing trade areas, like distance-based radius and drive times, may have worked for brands in the past, they don’t answer the critical question: “How are my customers actually traveling within my site’s trade area?” SiteZeus’ innovative approach is more precise, taking the guessing and uncertainty out of the picture. By leveraging your customers’ mobile location data inside SiteZeus’ A.I.-powered platform, you can visualize their paths to purchase and identify your brand’s true trade areas within minutes.
Step 1 Access all your mobile data in a single dashboard
Get started by purchasing and redeeming mobile tokens for each location you’d like to run a trade-area analysis on. You can buy a single mobile token, purchase them in bulk, or opt for an unlimited package. With the unlimited package, you’ll get the most up-to-date data, as well as the ability to easily redeem and refresh mobile data on an endless amount of locations.
Once you redeem a token for a location, you’ll have data on all of the mobile trips customers have taken to and from that site in the last 365 days. To get the most recent 365 days’ worth of trips, just refresh the site’s data with a new token.
You can manage and access your data anytime by jumping into the Mobile Data Dashboard. The dashboard will give you an instant, comprehensive glance at each site’s information, including the address, status of mobile data, and token redemption date.
Step 2 Visualize your customers’ paths to purchase
Simply click the site’s address in the Mobile Data Dashboard or click the pin directly on the map and select the mobile data button at the top of the screen. Within seconds, colored dots representing mobile device pings will populate on your screen, showing you the actual paths your customers have taken to your site over the last 365 days.
By navigating to the legend on the bottom right of your screen, you can gain insights on
- the average distance your customers traveled to your site,
- the most common times your customers visited your site,
- the average time your customers traveled during specific time intervals, and
- where traffic to your site during specific time intervals actually came from.
Getting a snapshot of any overlap in trade areas between multiple sites is easy, too. You can pin up to 10 sites at a time and see each location’s mobile data represented in a different color.
Step 3 Understand your sites’ true trade areas with Optimal GeoSpace Polygons
Historically, real estate teams have used concentric rings or drive times to determine trade areas. However, these methods don’t give the full story of a site’s true trade area. Concentric rings don’t account for the fact that customers simply don’t travel in perfect geometric shapes. By relying on concentric rings, you risk missing certain pockets of high activity. Drive times don’t account for the convenience factor, and they also assume that customers travel equally from each direction. By relying on drive times, you risk not developing a true understanding of your customers’ actual, fluctuating travel patterns.
And while mobile data can include customers who may not be regular visitors, Optimal GeoSpace Polygons can make your data analysis more accurate than ever. By looking at the 60, 70, and 80 percent trade-area polygons, you’ll gain a clear picture of where the majority of your customers are actually traveling from and the size and shape of a site’s true trade areas.
By using the Optimal GeoSpace Polygons, you won’t have to deal with the uncertainties and inefficiencies of traditional trade area identification methods. With SiteZeus’ upgraded method that uses nuanced data, you’ll rapidly get accurate and actionable insights into the true trade areas of each of your sites. With that data, you can take additional steps to grow your brand, such as by
- creating more comprehensive customer personas,
- optimizing a site’s hours of operation to better accommodate peak traffic,
- determining which promotions to prioritize (e.g., whether you should offer more breakfast deals), and
- identifying advertising opportunities to attract more customers based on traffic levels and patterns (for instance, putting up billboards on certain roads).
Analyzing a site’s mobile data is the starting point for developing its growth strategy. You’ll have peace of mind that you’re growing your brand more strategically every step of the way.
Recommended Posts

