Identify markets where your brand would thrive in minutes
SiteZeus brings an A.I. solution to white space analyses
Traditional white space analysis methods take multi-unit brand’s two to four weeks to conduct and can vary in accuracy. Waiting that long for analysis drastically slows down the timeline for opening new locations. Attempting to find data driven answers to questions like, “What market should I enter next?” or “Where should I open my first location in this new market?” can be difficult. SiteZeus’ A.I.-powered white space analysis solution, Site Sonar, runs up to 50,000 sales projections across the US and Canada in a matter of minutes, helping brands evaluate sales potential in new markets with greater accuracy than ever before.
Step 1 See how your brand would perform at any POI across the nation
SiteZeus’ method of evaluating white space calculates revenue projections for your brand at any point of interest across markets in the US and Canada. These proxy sites act as a placeholder for your brand.
When deciding on what locations to run the analysis on, you can be specific with a brand search and select a large nationwide company, like Walmart or Starbucks, to visualize your brand’s performance in all markets. You can also select an entire category, such as supermarket or sporting goods.
If you know your synergistic brands, running the analysis on them can quickly show you hot spots where a new location of yours would thrive.
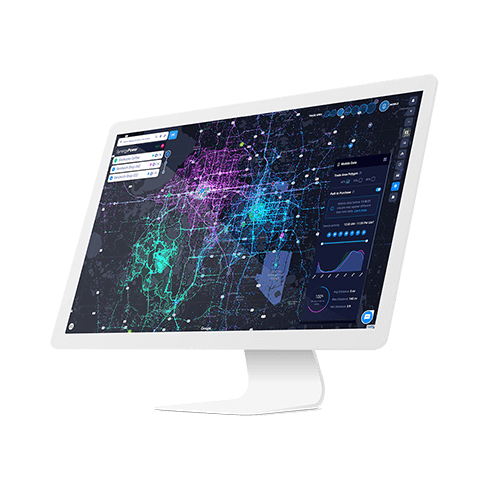
Step 2 Watch as colored dots representing sales forecasts blanket the map
Within minutes, results will be calculated, and each location will be shown with a different colored dot. A legend will also appear which shows the range of revenue values. The color of each dot does not represent that specific store’s current sales, but instead what your concept would be forecasted to make if you opened at that location.
Step 3 Narrow down results with your revenue threshold
The Site Sonar legend also features a slider, allowing you to define the minimum and maximum revenue range. Using this feature will simplify your view, reducing noise, so you can focus on the sites that meet your ideal sales volume.
Step 4 Understand your brand’s maximum potential in different markets by setting your distance threshold
In the Site Sonar legend, you’ll see a slider that enables you to put a minimum distance between each of the Site Sonar points on the map and your brand’s existing locations. After choosing your desired distance and clicking the “Update” button, the results will recalculate. Any points that fall in between your specified distance will be removed from the map. With this feature, you’ll get a clear picture of how many locations your brand can fit in a particular market—and avoid cannibalizing sales between new locations and existing sites.
Step 5 Zoom into ideal markets for detailed results
The full map view can show you regions where your brand has promising potential. You can direct your attention to these areas by zooming in and finding which markets have the highest revenue projections. If you already have a new state or region in mind, you can easily shift you focus and the find the optimal market in that area. Hovering over any dot will reveal the revenue forecast for your brand at that particular location.
While some brands still wait weeks for a new analysis each time they want to enter a new market, brands leveraging SiteZeus identify areas they would thrive within minutes. Expedite the timeline of penetrating news markets by months and start producing revenue at a new location that much faster.
Recommended Posts