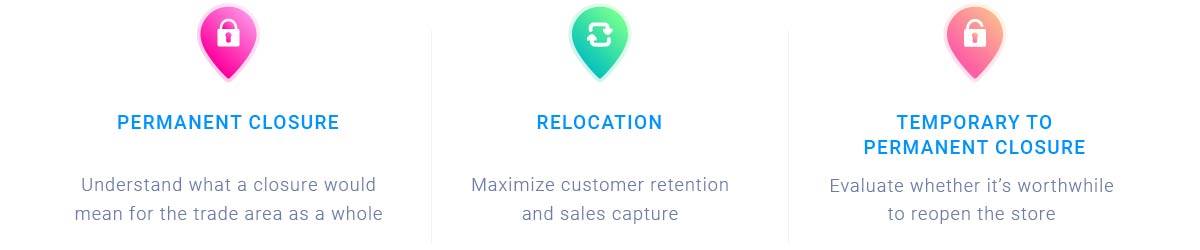
Implement strategic closures and relocations with SiteZeus’ new impact analytics
An underperforming or poorly positioned store can hurt your average unit volume and cannibalize sales. With variables like changing customer demographics, moving competitors, new lease terms, and population movement, most brands — especially legacy ones — will need to embrace closure and relocation studies as part of a healthy market-planning strategy.
Protecting existing revenue and maximizing market share is easy with SiteZeus’ closure impact solution, which uses mobile data to analyze customers’ paths to purchase and predict how their behavior would change in response to a store closure or relocation.
Leave tedious pin studies and surface-level financial decisions where they belong — in the past!
Whether you’re adapting to evolving market conditions or proactively looking for ways to optimize your portfolio, you can use our groundbreaking closure analysis solution to quickly and confidently refine your site placement in established markets.
With SiteZeus’ closure impact solution, you get an industry-specific model built from more than 6 million data points across urban, suburban, and rural communities. The analyses have a 92 percent accuracy rate thanks to their reliance on 365 days’ worth of mobile location data showing start-to-finish customer trips.
Step 1 Select your network of sites
After navigating to the store that you’re considering closing, select up to 10 surrounding sites to include. If you plan to relocate the store, one of these sites should be its prospective location. The more sites you add to the analysis, the clearer the picture you’ll get.
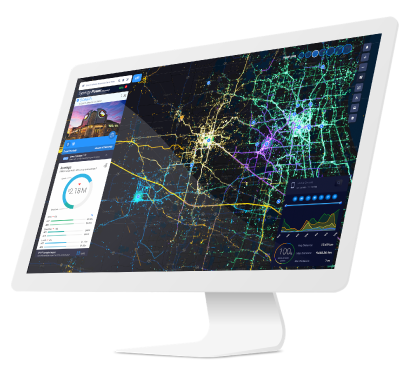
Step 2 Use color-coded visualizations to understand customer transfer
The mobile data for the store will populate in different colors on the map to indicate how trips would transfer to the nearby sites. The trips shown in red are the ones likely to be lost altogether, and the remaining trips are color-coded to reflect which store they would transfer to. Use the legend in the bottom-right corner to easily switch between visualizations of your customers’ last stop, common daytime location, and common evening location.
Step 3 Break it down by the numbers
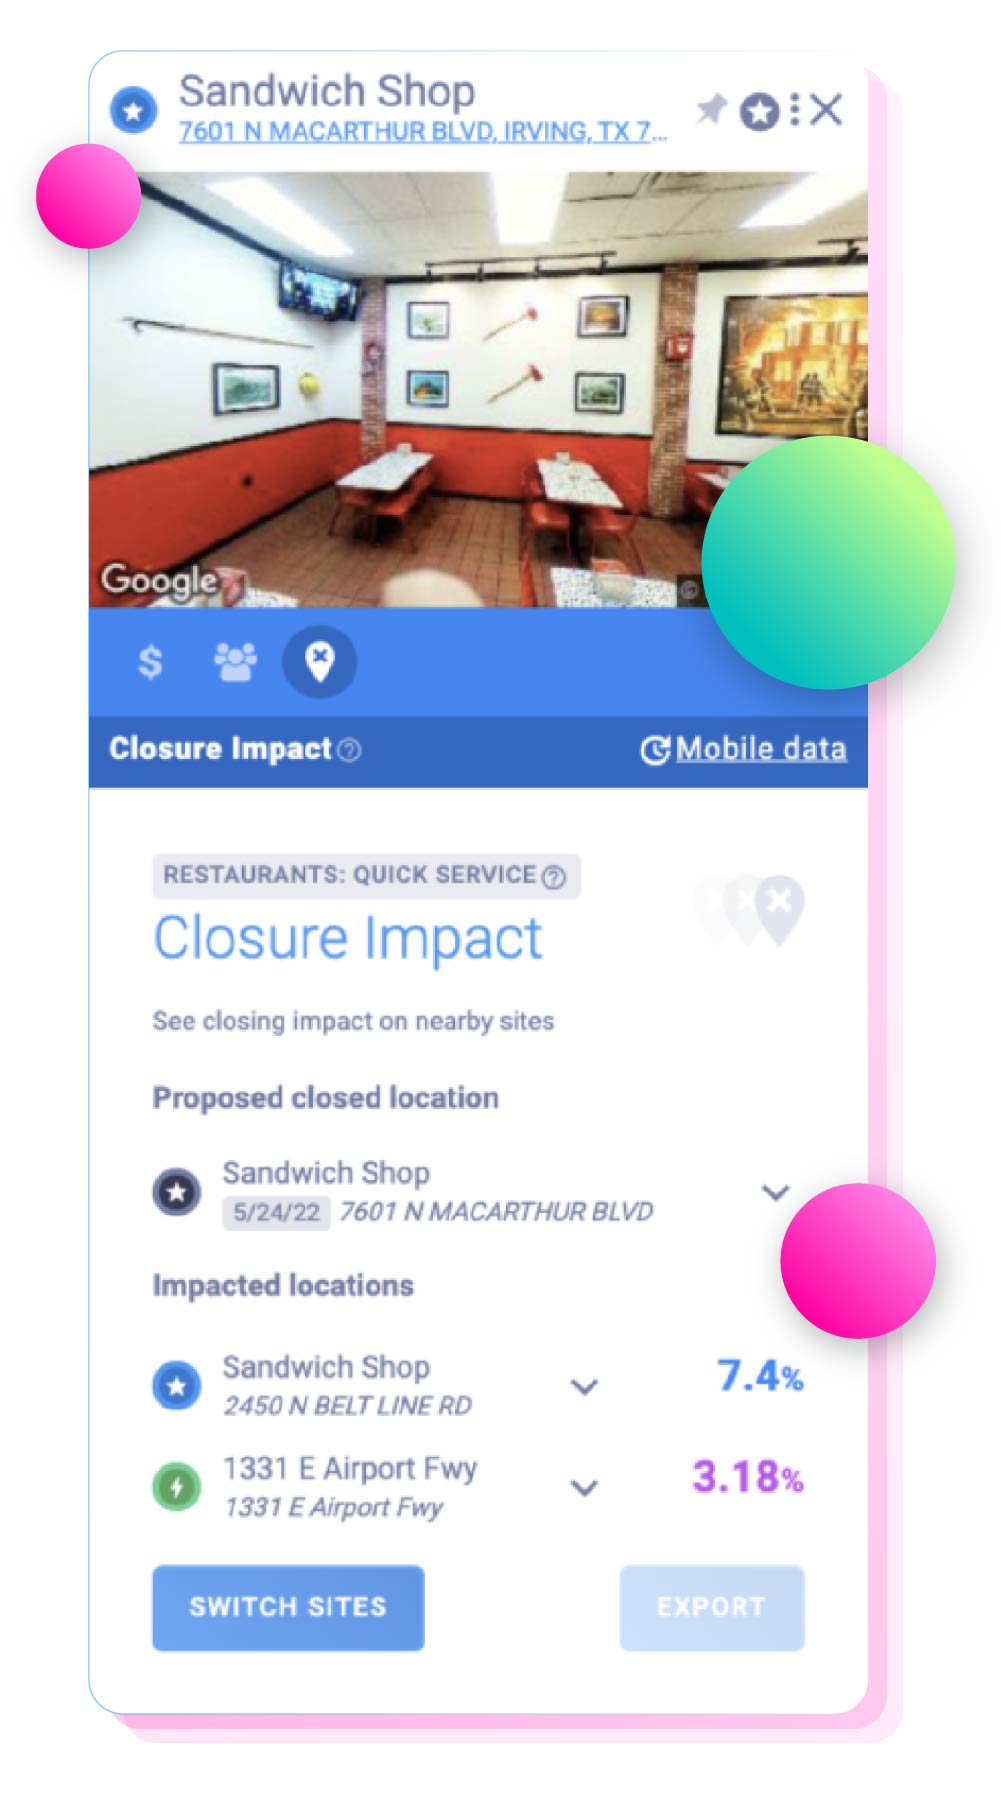
In the left-hand panel, you can dig into the details to better understand the relationship between the sites. By knowing which stores would see a significant lift in sales, you can prepare them with additional staffing and supplies.
For the site you’re considering closing, you’ll see
- the number, percentage, and dollar value of the trips projected to transfer; and
- the dollar value of the trips projected to be lost.
For each nearby site included in the analysis, you’ll see
- the number, percentage, and dollar value of the trips projected to transfer to the site; and
- the adjusted sales calculation.
Step 4 Analyze the results and take action
With these clear visualizations and precise projections, you can optimize store placement to raise your AUV while preserving your customer base. Whether the results confirmed or disproved your theories, they’ve equipped you to draft a plan with peace of mind and present it to your team with confidence.
Step 5 Repeat in different markets to keep your portfolio in peak condition
In today’s fast-paced environments, what worked yesterday might not work today — even if you thorougly vetted the original site placement. Luckily, you can test unlimited closure scenarios in SiteZeus at no extra cost. Boasting the same real-time results and accuracy as the rest of SiteZeus’ solutions suite, this new tool gives you the opportunity to complete your market-planning strategy.
Learn more about how strategic closures and relocations can keep your brand ahead in any economy.
Recommended Posts